Troubleshooting
This document aims to assist you in troubleshooting issues with the Tabby extensions for various IDEs such as VSCode, IntelliJ Platform IDEs, and Vim / NeoVim.
Tabby Initialization Failed?
This problem may occur when you first install the Tabby in IntelliJ Platform IDEs or Vim/NeoVim.
The Tabby IDE extension runs its core logic in the Tabby agent. In the case of VSCode, the agent runs within the VSCode Extension Host, while for IntelliJ Platform IDEs and Vim/NeoVim, the agent runs as a separate Node.js process.
Install Node.js
You can follow the instructions on the Node.js website
to install Node.js. Alternatively, you can use a version manager such as nvm.
Note: Tabby IDE extension requires Node.js version 18.0.0 or higher.
Specify Node Binary Path
If the node binary is already accessible via your PATH environment variable,
you can skip this step. Otherwise, you will need to specify the path to the node
binary in the IDE settings.
For IntelliJ Platform IDEs (Tabby plugin version 0.6.0 or higher):
- Click on Tabby plugin status bar item and select
Open Settings.... - Enter the path to the node binary on your system in the
Node binaryfield, e.g./usr/local/bin/node,C:\Program Files\nodejs\node.exe.
If you are using a version manager such asnvm, you can enter the path to the node binary installed by the version manager, e.g.~/.nvm/versions/node/v18.18.0/bin/node. - Restart the IDE
If you installed Node.js via snap, please use /snap/node/current/bin/node rather than
/snap/bin/node as the node binary path.
Cannot Connect to Tabby Server?
If you have setup the endpoint for the Tabby server but the status bar item of the Tabby IDE extension still displays a mark indicating "Disconnected", follow the steps below to troubleshoot the issue.
Check Endpoint Settings
Verify that the endpoint setting is correct. You can set the endpoint in the
IDE settings page (except for Vim/NeoVim, which do not have this option) or by
editing the config file.
Keep in mind that the IDE settings take priority over the config file.
If you wish to use the setting from the config file, ensure that the IDE setting
is empty.
Authentication Token
If you have enabled authentication on your Tabby server, you will need to set the authentication token in the IDE or the config file.
Verify Tabby Server Status
Once the Tabby server is running, it should display a log message such as
Listening at 0.0.0.0:8080.
Open your browser and navigate to http://localhost:8080/swagger-ui/
(Replace localhost:8080 with the correct IP/domain and port if you have setup your
Tabby server on a remote machine). The browser should display a web page with Swagger UI.
To test the server, expand the /v1/completions section, click on Try it out,
and then click Execute.
If you receive a response, it indicates that the Tabby server is running properly.
You can also use curl to send a completion request to Tabby server. For example:
curl -X 'POST' \
  'http://localhost:8080/v1/completions' \
  -H 'accept: application/json' \
  -H 'Content-Type: application/json' \
  -d '{
  "language": "python",
  "segments": {
    "prefix": "def fib(n):\n    ",
    "suffix": "\n        return fib(n - 1) + fib(n - 2)"
  }
}'
If you can not see Swagger UI page, or can not get response of completion request, please check the server log to see if there is any error.
Proxy Settings
Please note that Tabby extensions for IDEs currently do not support proxy settings. If you need to access your Tabby server through a proxy, consider setting up a reverse proxy and using the reverse proxy URL as the endpoint for the Tabby IDE extension.
Cannot Get Any Completions?
If you are able to connect the Tabby extension to the Tabby server but are unable to receive any completions, you can follow the steps below to troubleshoot the issue.
Check Trigger Mode Settings
Tabby is set to automatic trigger mode by default. In this mode, you should receive
completions after a short delay when you stop typing. The delay may vary depending
on your server's performance and settings.
If you are using manual trigger mode, you need to press Alt + \ (Ctrl + \ for IntelliJ and Vim plugins)
to trigger a completion request. The status bar item of Tabby IDE extension should show a loading
indicator for a brief period before displaying the completions.
Keep in mind that Tabby may not provide any suggestions if there is no necessary
for the current code context.
Check Request Timeouts
If your completion requests are timing out, Tabby may display a warning message.
This could be due to network issues or poor server performance, especially when
running a large model on a CPU. To improve performance, consider running the model
on a GPU with CUDA or ROCm support or on Apple M1/M2 with Metal support. When running
the server, make sure to specify the device in the arguments using --device cuda, --device rocm or
--device metal. You can also try using a smaller model from the available models.
Problems with the Chat Panel?
Check Server Enabling Chat Feature
The chat panel is a feature that requires the Tabby server to enable the chat feature. Please make sure that the chat feature is properly configured in the server configuration file or that the server is started with the --chat-model MODEL_NAME flag.
You can access the server management page at https://demo.tabbyml.com/system to check if the chat feature is enabled.
Check Browser Compatibility in IntelliJ Platform IDEs
The chat panel in IntelliJ Platform IDEs is implemented using an embedded JCEF browser. The support is included in the default Java Runtime for JetBrains IDEs, but it may not be by default in Android Studio.
Please follow the steps below to ensure that the JCEF browser is enabled in your IDE:
- Open
Search Everywhere(DoubleShift) orFind Action(Ctrl + Shift + A), and search for the actionChoose Boot Java Runtime for the IDE... - Select a Java Runtime that includes JCEF support
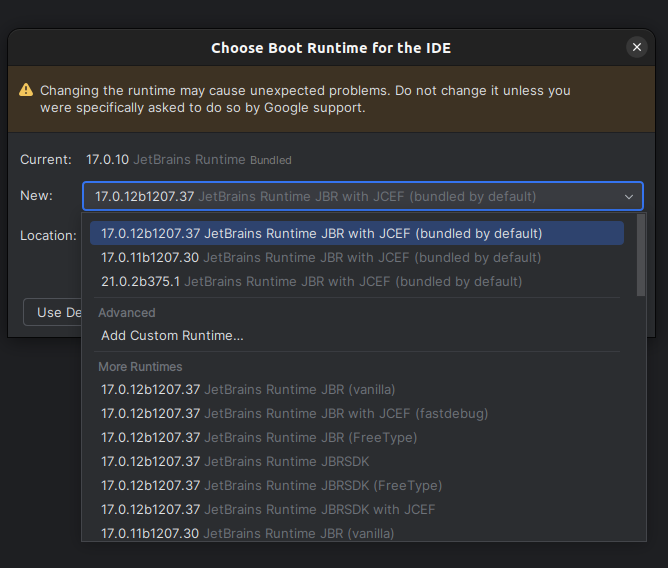
- Restart the IDE
Want to Deep Dive via Logs?
If you cannot solve the issue using the previous steps, you may want to investigate further by checking the logs of Tabby extensions. If you want help from the community, it is also recommended to share the logs of the Tabby extensions.
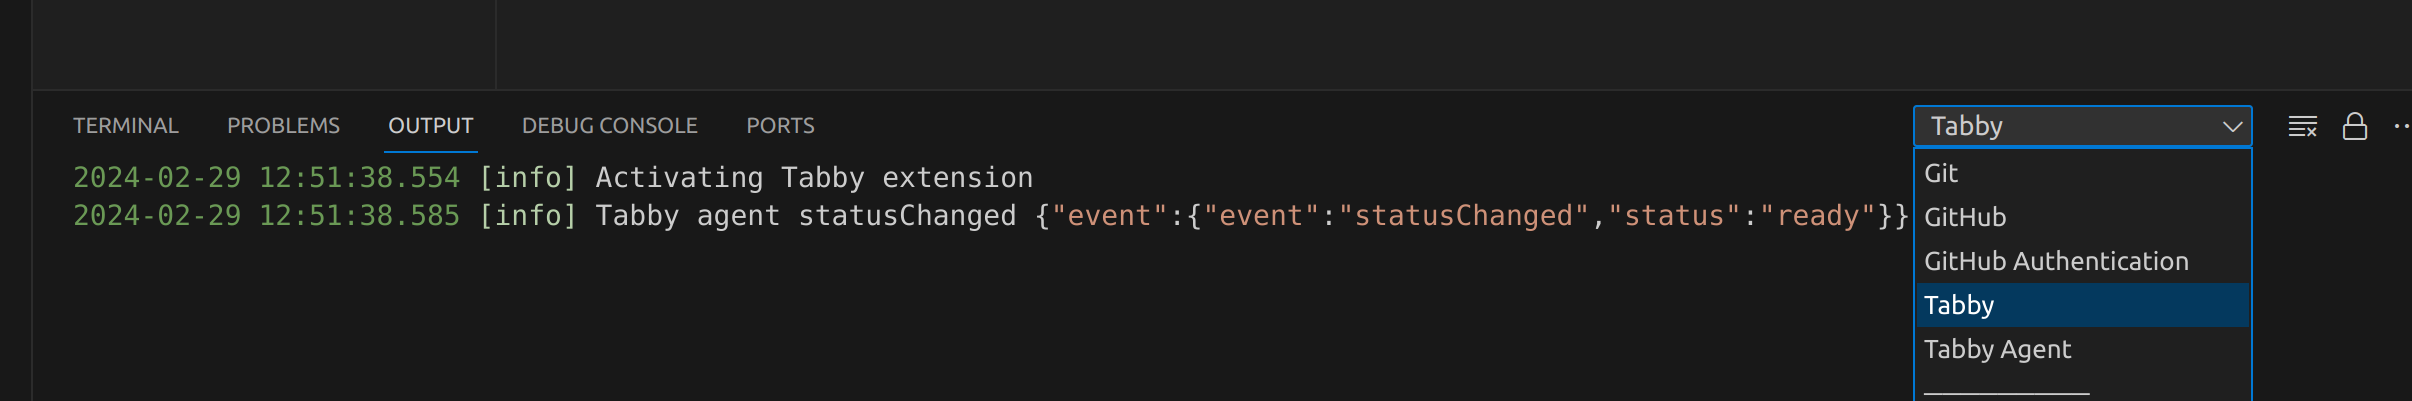
VSCode
For VSCode, you can check the Output window and select the Tabby channel or
Tabby Agent channel.
 The default log level is
 info. To enable debug logs, you can use the command
Developer: Set Log Level... to set the log level to debug.
IntelliJ Platform IDEs
For IntelliJ Platform IDEs, you can check the logs for the IDE using Help -> Show Log in Explorer|Finder|Files...,
or follow this document to locate the log file.
This log file contains all the logs for the IDE, and you can filter them by searching for the
keyword com.tabbyml.intellijtabby.
You can also enable all level logs by editing Help -> Diagnostic Tools -> Debug Log Settings... and
add com.tabbyml.intellijtabby:all to the list.
Tabby Agent Logs
As the agent runs as a separate Node.js process for IntelliJ Platform IDEs plugin and Vim/NeoVim plugin, its logs are written separately.
By default, the agent logs are set to "silent", which means the agent logs are
not written to disk. To enable Tabby agent debug logs, editing the
config file,
uncomment the logs section and set level to "debug", then save the file
to apply the changes.
You can find the agent logs in the ~/.tabby-client/agent/logs directory. These
logs are written using pino, and you can
use pino-pretty to format the log file for easier readability.
tail -f ~/.tabby-client/agent/logs/20240101.0.log | npx pino-pretty
Still Have Issues?
If you still have any issues, please feel free to open an issue on github, or join our slack community for further support.